How Much Energy Does a Solar Panel Produce by Size?
You’re staring at solar panels online (or on your roof), and the numbers feel… weirdly unhelpful. 400W, 550W, 6 kW system—cool, but what you really want to know is:
How much energy does a solar panel produce for your actual life—phone charging, lights, a fridge that never sleeps, and maybe even an air conditioner that tries to fight the sun with the sun.
Affiliate disclosure: This article includes a short Amazon product section for helpful solar tools.
Quick answer: typical kWh a panel makes
Here’s the “napkin math” version (we’ll refine it later):
- A 100W panel often makes ~0.25–0.6 kWh/day
- A 400W panel often makes ~1.0–2.4 kWh/day
- A 550W panel often makes ~1.4–3.3 kWh/day
That’s a range on purpose—because solar is like cooking rice. The “recipe” is simple, but your stove (location), pot (roof angle), and lid (shade/clouds) change the result.
A realistic default assumption for many grid-tied setups is ~14% system losses (before inverter modeling), and PVWatts’ default settings roughly translate to an overall “real-world” factor around ~0.82 when you combine losses with a typical inverter efficiency.
Watts vs watt-hours: what you’re really asking
A panel’s W (watts) rating is “how hard it can push” under lab-like conditions—not how much it produces in a day.
What you actually care about is:
- Energy = watt-hours (Wh) or kilowatt-hours (kWh) over time
Think of it like a water tap:
- Watts = how wide the tap can open
- kWh = how many buckets you fill by the end of the day
Also, those lab conditions assume strong sunlight around 1,000 W/m² (that’s the “full sun” reference used for standard test conditions).
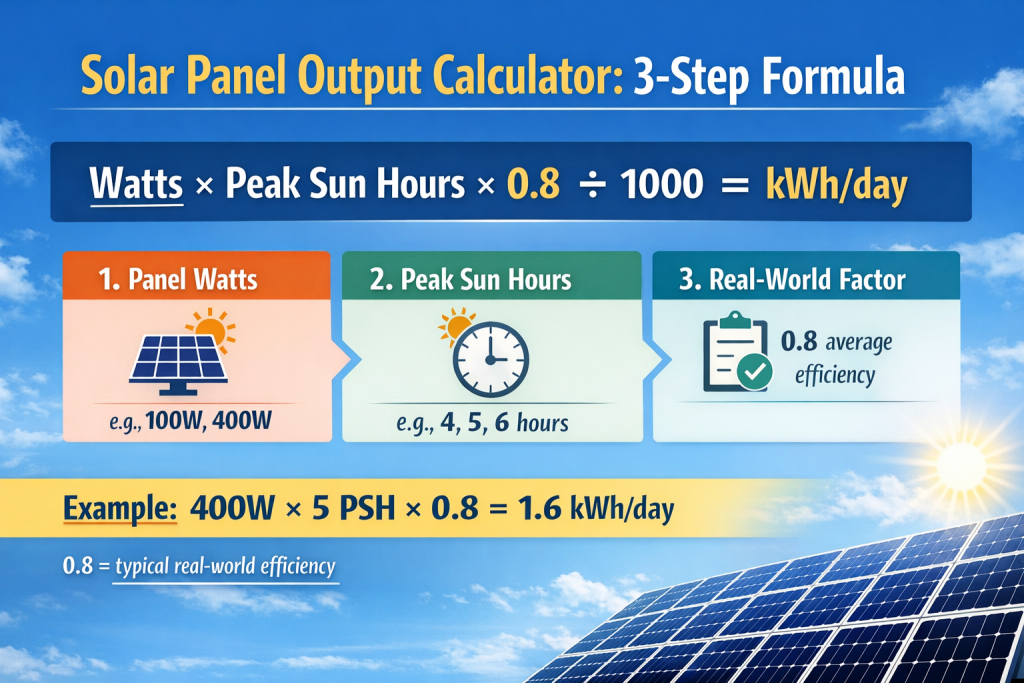
The 3-number formula to estimate solar energy
If you want a clean estimate without getting a PhD in clouds, use this:
Daily energy (kWh) ≈ Panel watts × Peak Sun Hours × Real-world factor ÷ 1000
1) Panel watts (W)
Example: 400W panel.
2) Peak Sun Hours (PSH)
This is the “sunlight budget” your location gets per day (more on this soon).
3) Real-world factor (usually 0.75–0.85)
This bakes in common losses: wiring, dirt, mismatch, and the fact that life is not a lab. PVWatts uses a default 14% system loss input and models inverter efficiency separately.
Example (400W panel)
- 400W × 5 PSH × 0.82 ÷ 1000
= ~1.64 kWh/day
That’s often the “aha” moment: one panel can do a lot… but it’s not magic.
How much energy does a 100W panel produce? (and 200W, 400W, 550W)
Let’s use a realistic real-world factor of 0.82 (PVWatts-style default thinking).
Then I’ll show you a quick range using PSH = 3, 4, 5, 6 (common across many regions).
Estimated daily kWh by panel size
- 100W panel
- 3 PSH: ~0.25 kWh/day
- 6 PSH: ~0.49 kWh/day
- 200W panel
- 3 PSH: ~0.49 kWh/day
- 6 PSH: ~0.98 kWh/day
- 400W panel
- 3 PSH: ~0.98 kWh/day
- 6 PSH: ~1.97 kWh/day
- 550W panel
- 3 PSH: ~1.35 kWh/day
- 6 PSH: ~2.71 kWh/day
If you’re thinking, “Okay… so how many panels do I need?”—you’re already asking the right question.
Solar production by system size (1 kW to 10 kW)
Solar systems get discussed in kilowatts (kW):
- 1 kW system = 1,000W worth of panels (roughly 2–3 modern panels, depending on wattage)
Rough daily energy by system size (using 0.82 real-world factor)
At 5 peak sun hours:
- 1 kW → 1,000W × 5 × 0.82 ÷ 1000 = ~4.1 kWh/day
- 3 kW → ~12.3 kWh/day
- 5 kW → ~20.5 kWh/day
- 10 kW → ~41 kWh/day
Now connect that to real life:
- A small apartment might use ~5–15 kWh/day
- A family home might use ~15–40+ kWh/day (especially with heavy cooling)
Your mileage varies a lot—but the math stays friendly.
Peak sun hours: the “sunlight budget” that changes everything
Peak Sun Hours is basically:
“If today’s sunlight were squished into perfect noon sun, how many hours would that be?”
So a place with 5 PSH isn’t sunny for only 5 hours—it means the total sunlight adds up to that equivalent.
This is why two identical 400W panels can behave like totally different animals in different locations.
And if you want a confidence boost: PVWatts is designed to estimate energy production from typical weather data, and it notes that results should be treated as representative estimates—not exact guarantees.
Irradiance, clouds, and weather: why “sunny” isn’t binary
Some days you get crisp, high-output sunshine. Other days you get “bright but… not productive.”
A few quick truths:
- Thin clouds can still give decent output.
- Thick clouds + rain can crush production.
- Haze, smoke, humidity can quietly cut energy without looking dramatic.
So when someone says “my panel should make X every day,” I gently translate it to:
“On average, across a normal year.”
PVWatts even warns that annual totals can deviate from long-term typical conditions, and monthly swings can be larger.
Tilt and direction: the angle that quietly steals (or saves) energy
Angle is like aiming a flashlight at a wall:
- Straight on = bright
- Tilted away = dimmer
Your best tilt depends on latitude and goals:
- Want more annual energy? Aim for a balanced tilt.
- Want more winter energy? Tilt a bit steeper.
- Want more summer energy? A bit flatter can help.
If your roof is fixed, don’t panic. Solar still works well on “not perfect” roofs—you just plan with realistic expectations.
Shade and dirt: tiny problems that add up
Shade is sneaky because it can be partial and still hurt.
Common shade culprits:
- Trees (especially morning/late afternoon)
- Neighbor roofs
- Chimneys
- Satellite dishes (yep)
And then there’s dirt:
- Dust, pollen, bird droppings
- Coastal salt residue
- Dry-season grime
PVWatts’ default loss breakdown includes assumptions for things like soiling and shading, and those defaults are small individually—but meaningful together.
Heat: why panels can produce less on hot days
This one surprises people: hotter panels often make less power.
PVWatts’ manual includes typical temperature coefficients (how output changes with temperature), such as around -0.47% per °C for “standard” modules in its assumptions table.
So yes—summer has longer days, but a scorching roof can shave off some performance right when you want it most.
System losses: inverter, wiring, mismatch, and the real-world haircut
Even if your panels are perfect, the system still loses some energy on the way to your outlets.
Common losses include:
- Wiring and connections
- Panel mismatch
- Soiling/shading
- Availability (downtime)
- Light-induced degradation early on
PVWatts V5 uses a default total system loss of 14% (calculated multiplicatively from loss components) and models inverter efficiency separately.
If you want a practical shortcut: most homeowners get better decisions from “good estimates” than from pretending they can predict every cloud.
Seasons and latitude: what changes month to month
If you live somewhere with strong seasons, your solar output can feel like:
- Summer: “Wow, free electricity!”
- Winter: “Okay… that’s… something.”
Even in tropical climates, rainy seasons can swing production.
What matters:
- Day length
- Sun angle
- Cloud patterns
- Temperature
So when you size a system, always look at monthly expectations, not only the best month.
Aging and degradation: what to expect after 10, 20, 25 years
Panels slowly produce less as they age. The good news: modern panels tend to degrade fairly gently.
A widely cited NREL review found a median degradation rate of ~0.5% per year across reported datasets (with most rates below 1%/year).
What that means in human terms:
- After 10 years, you might see roughly ~5% less output (ballpark).
- After 25 years, you might still have plenty of useful production—just not “day one” levels.
A 5-minute estimate for your home (with examples)
If you want a quick, surprisingly accurate back-of-the-envelope estimate:
Step 1: Find your daily kWh usage
Check your electric bill or utility portal.
Step 2: Pick your PSH
If you don’t know it, use a conservative placeholder like 4 or 5 and refine later.
Step 3: Decide your real-world factor
Use 0.80–0.83 as a reasonable planning range (PVWatts defaults land in that neighborhood).
Step 4: Solve for system size (kW)
System kW ≈ Daily kWh ÷ (PSH × real-world factor)
Example A: You use 15 kWh/day
- PSH = 5, factor = 0.82
- kW ≈ 15 ÷ (5 × 0.82) = ~3.66 kW
Example B: You use 30 kWh/day
- kW ≈ 30 ÷ (5 × 0.82) = ~7.32 kW
And yes—this is where people realize why running heavy cooling on solar takes serious capacity.
Product Section: tools that help you measure, monitor, and optimize
If you’re serious about answering how much energy does a solar panel produce for your setup, measurement tools are your best friend. (Add your affiliate links to these product names as needed.)
1) P3 International P4400 Kill A Watt Electricity Usage Monitor
What it does: Plug it into an outlet and measure kWh, watts, and cost for an appliance.
Features: Simple display, kWh tracking, great for “what does my fridge actually use?” reality checks.
Best for: Renters, beginners, anyone auditing loads before sizing solar. (Amazon listing shows strong review volume and rating.)
2) Emporia Vue 3 Home Energy Monitor (Whole-home)
What it does: Tracks home energy usage through your electrical panel (usually installed with help).
Features: Circuit-level monitoring, app dashboards, great for spotting “mystery usage.”
Best for: Homeowners who want clean data before buying panels.
3) Victron Energy SmartSolar MPPT Charge Controller (Bluetooth models)
What it does: Optimizes solar charging (especially off-grid/RV setups) and shows production data.
Features: MPPT efficiency benefits, Bluetooth monitoring, strong ecosystem.
Best for: Off-grid cabins, RVs, battery-based systems where every watt matters.
4) Victron Energy SmartShunt Battery Monitor
What it does: Tracks battery state of charge and energy in/out—so you can see what your solar actually delivers over time.
Features: App monitoring, accurate shunt-based measurement, great troubleshooting tool.
Best for: Anyone with batteries who wants clear, trustworthy numbers.
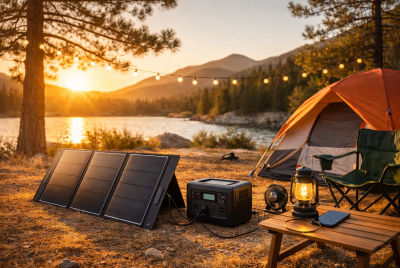
5) ECO-WORTHY 400W Solar Panel Kit (4×100W)
What it does: A common “starter scale” panel bundle that makes sizing feel real, not theoretical.
Features: Modular panels, off-grid-friendly use cases.
Best for: DIYers building small systems (shed, RV, backup).
Quick note on cooling: If your big question is “Can solar run an AC?” you’ll want to read this next because cooling loads change the entire sizing conversation: Solar power air conditioner sizing and options
Research-backed section (credibility) + FAQs
Two reliable references to ground your estimates
- The PVWatts model is a widely used estimator that documents assumptions like default losses and typical uncertainty ranges. Read: PVWatts Version 5 Manual (NREL, 2014).
- For long-term output, this NREL review summarizes global degradation findings and reports a median degradation rate around 0.5%/year. Read: Photovoltaic Degradation Rates—An Analytical Review (NREL, 2012).
FAQs
How much energy does a solar panel produce per day?
Most panels produce about 1–3 kWh/day depending on panel wattage (like 400–550W), peak sun hours, and real-world losses. A quick estimate is: W × PSH × 0.8 ÷ 1000.
What is the daily energy production of a 400W solar panel?
A typical range is ~1.0–2.0 kWh/day. For example, at 5 peak sun hours with a 0.82 real-world factor: 400 × 5 × 0.82 ÷ 1000 ≈ 1.64 kWh/day.
What is the monthly energy production of a solar panel?
Multiply your daily estimate by ~30. So if one panel makes ~1.6 kWh/day on average, that’s ~48 kWh/month. (Monthly weather swings can be noticeable.)
What factors reduce solar panel output the most?
Big hitters include lower peak sun hours, shade, poor tilt/direction, soiling, and heat. System losses (wiring, mismatch, availability) also add up. PVWatts uses a default system-loss assumption of 14% as a starting point.
How many solar panels do I need to produce 30 kWh per day?
First estimate your daily kWh per panel. A 400W panel at 5 PSH might average ~1.6 kWh/day. Then:
30 ÷ 1.6 ≈ 19 panels (roughly). Your location and roof conditions can move that up or down.
Conclusion (real talk):
If you remember one thing, make it this: how much energy does a solar panel produce comes down to watts × sun hours × real-world losses. Once you plug in your own usage, the decision gets calmer—less guessy, more confident.
If you want, paste (1) your daily kWh usage and (2) the panel wattage you’re considering, and I’ll run the numbers in a clean, realistic range (and tell you what assumptions I used).